Here in the UK the General Election has seen numerous skirmishes amongst the politicians about the National Health Service (NHS). They bombard us with figues in unimagnable „billions“ of pounds. However, I have not seen any debate about how to make use of spatial data to make the NHS better informed and more responsive to need. Yet health service provision is highly spatialised, the more so since the closures of cottage hospitals and the concentration of facilities in fewer, larger hospitals. Local access to health care professionals also varies spatially, not just between urban and rural areas, but also between suburbs and inner city areas. Similarly, there are strong spatial aspects to the incidence of need. New work in the USA is using big data to begin to highlight the challenges and opportunities.
Where do asthma attacks happen?
Increasing numbers of people have to live with asthma, and carry inhalers to dispense the medecine into their lungs when needed. While there are different types of inhaler and different patterns of prescription, inhalers are frequently used when the patient feels the need for relief. That is where the spatial dimension comes in. Where do asthma attacks occur more frequently, and what can we learn from the pattern?
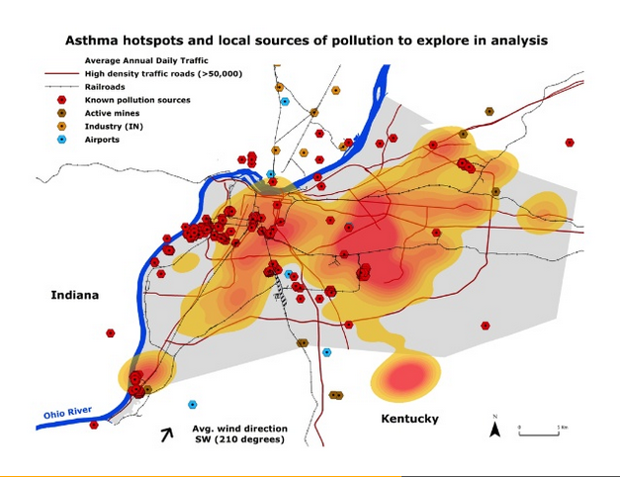
Louisville is one of the worst cities in the USA for air pollution. Now it has put GPS trackers inside inhalers. This allows them to track the time and place where the asthma patient takers a puff from the inhaler. When these individual plots are combined, you have a map of asthma hot-spots in the city. 
Such data can be used in various ways. Doctors can vary their prescriptions to take account of the likely exposure of patients to these places, e.g. because of where they live or work. Combined with other sets of big data – on traffic flows or local vegetation, for example – it becomes possible to explore mitigation strategies.
Innovation in local government
This initiative in Louisville is funded by a philanthropic foundation. It fits into a pattern that I discussed in a recent blog on the Planning Resource website (though it is behind a paywall so not accessible to some readers). I explained how urban innovation is being supported.
For example, Bloomberg Philanthropies has given more than $150M to almost 70 municipal councils. The money is used to fund innovations teams in the mayor’s office. They are staffed by a mix of experienced public sector professionals and people from the private sector. There is a strong emphasis on using data and delivery of measurable results through better coordination across departmenrs and between the public and private sectors.
Ted Smith is the Director of Economic Development and Innovation for the City of Louisville. He sees the „Asmathpolis“ project as contributing to regional competitiveness, since „When employers come into town, they want to know how healthy the workforce is.“
„Once we shift from simply monitoring and reporting to “data science” or hypothesis-driven data collection and combination, we can begin to inform public debate and policy creation. All of this technology—especially sensor technology—gives us a new and robust vista on the issues in our built environment.“
Where is the best place to get shot in Chicago?
Experienced professionals may be unsure about how to use big data, but a new generation is coming through university schools of geography who are very comfortable with it. Alex Williams created a couple of fascinating maps for his coursework in his undergraduate GIS class at De Paul University .
He mapped Police Department data on where shootings take place and measured the driving distance from these hotspots to the nearest Level 1 trauma centre where emergency medical help is available. This really matters because if you get shot speedy access to treatment can significantly affect your chances of survival.
What Williams‘ maps show is that „the areas of Chicago currently experiencing near epidemic levels of gun violence are also often the areas with the most limited access to the highest level of emergency care.“
Spatially informed policy making
These new technologies open the way for policy making to be better informed by adding a spatial dimension. So much of public administration has taken place in silo-like departments that are spatially blind. Innovation and big data may be about to change that. Meanwhile, our UK politicians are still fighting our election by conjuring „billions of pounds“ to cut or to spend, while saying nothing about innovation.
Schreibe einen Kommentar